SOMIÓ-GIJÓN - febrero 2003
Resumen del mes:
Nota: Estos datos se han actualizado a
las 07:21 del día 28/2/03 y, por consiguiente, no
corresponden al mes entero.
- Valores medios:
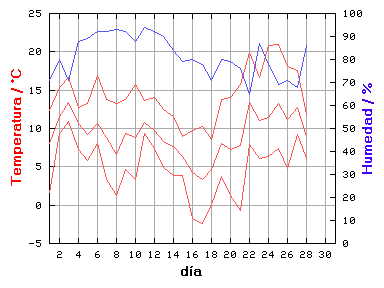
- Temperatura: 9.2 °C
- Humedad: 81 %
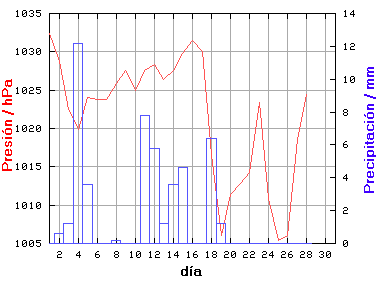
- Presión: 1021.5 hPa
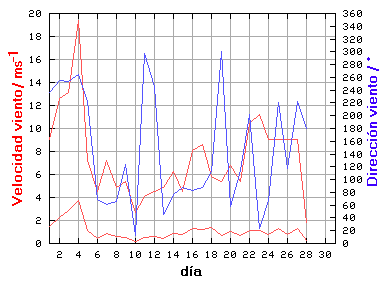
- Velocidad del viento: 1.1 m/s
- Dirección: 142 °
- Precipitación: 48.4 mm
- Valores extremos:
- Temperatura máxima: 20.9 °C el día 25 a las 12:00
- Temperatura mínima: -2.4 °C el día 17 a las 07:00
- Humedad máxima: 100 % el día 6 a las 06:00
- Humedad mínima: 39 % el día 26 a las 16:00
- Presión máxima: 1035.3 hPa el día 1 a las 00:00
- Presión mínima: 1003.0 hPa el día 26 a las 16:00
- Velocidad máxima del viento: 19.4 m/s el día 4 a las 06:00
- Precipitación máxima: 12.2 mm el día 4
Resumen diario:
| Día | Lluvia | Valores medios | Valores extremos |
|---|
| Temp | Hum | Pres | VV | DV | Temperatura | Humedad | Presión | VV |
| máx | mín | máx | mín | máx | mín |
|---|
| mm | °C | % | hPa | m/s | ° | °C | °C | % | % | hPa | hPa | m/s |
| 1 | 0.0 | 8.1 | 71 | 1032.4 | 1.5 | 236 | 12.3 | 1.7 | 87 | 56 | 1035.3 | 1029.7 | 9.0 |
| 2 | 0.6 | 11.6 | 80 | 1028.7 | 2.3 | 255 | 15.4 | 9.3 | 93 | 62 | 1030.5 | 1026.5 | 12.6 |
| 3 | 1.2 | 13.4 | 71 | 1022.5 | 2.9 | 254 | 16.6 | 10.9 | 87 | 59 | 1028.3 | 1017.0 | 13.1 |
| 4 | 12.2 | 10.7 | 88 | 1019.9 | 3.7 | 264 | 12.8 | 7.3 | 96 | 79 | 1025.0 | 1015.4 | 19.4 |
| 5 | 3.6 | 9.2 | 89 | 1024.1 | 1.1 | 222 | 13.2 | 5.8 | 99 | 71 | 1025.0 | 1021.8 | 7.2 |
| 6 | 0.0 | 10.6 | 92 | 1023.8 | 0.4 | 69 | 16.9 | 8.1 | 100 | 79 | 1024.8 | 1022.8 | 4.5 |
| 7 | 0.0 | 8.8 | 92 | 1023.8 | 0.9 | 61 | 13.8 | 3.3 | 100 | 82 | 1026.1 | 1021.4 | 7.2 |
| 8 | 0.2 | 6.6 | 93 | 1025.9 | 0.6 | 65 | 13.3 | 1.3 | 100 | 82 | 1027.5 | 1024.8 | 4.9 |
| 9 | 0.0 | 9.4 | 92 | 1027.5 | 0.5 | 123 | 13.8 | 4.7 | 100 | 77 | 1028.5 | 1026.9 | 5.4 |
| 10 | 0.0 | 8.8 | 88 | 1024.9 | 0.2 | 13 | 15.7 | 3.3 | 100 | 65 | 1027.0 | 1023.5 | 2.7 |
| 11 | 7.8 | 10.8 | 94 | 1027.5 | 0.5 | 298 | 13.6 | 9.3 | 99 | 85 | 1029.3 | 1024.6 | 4.1 |
| 12 | 5.8 | 9.7 | 92 | 1028.4 | 0.6 | 245 | 14.0 | 7.4 | 100 | 71 | 1029.4 | 1027.0 | 4.5 |
| 13 | 1.2 | 8.3 | 90 | 1026.4 | 0.4 | 45 | 12.5 | 4.9 | 99 | 72 | 1027.4 | 1025.6 | 4.9 |
| 14 | 3.6 | 7.6 | 84 | 1027.5 | 0.9 | 76 | 11.5 | 3.9 | 97 | 69 | 1029.2 | 1025.1 | 6.3 |
| 15 | 4.6 | 6.3 | 79 | 1029.8 | 0.8 | 88 | 9.0 | 3.9 | 97 | 59 | 1030.7 | 1028.8 | 4.5 |
| 16 | 0.0 | 4.2 | 80 | 1031.5 | 1.3 | 83 | 9.7 | -1.8 | 94 | 62 | 1033.5 | 1029.2 | 8.1 |
| 17 | 0.0 | 3.3 | 78 | 1030.1 | 1.2 | 87 | 10.3 | -2.4 | 96 | 62 | 1033.0 | 1026.2 | 8.6 |
| 18 | 6.4 | 4.6 | 71 | 1016.6 | 1.4 | 113 | 8.5 | 0.1 | 94 | 46 | 1026.2 | 1009.0 | 5.8 |
| 19 | 1.2 | 8.0 | 80 | 1006.0 | 0.7 | 300 | 13.8 | 3.7 | 94 | 54 | 1009.2 | 1003.8 | 5.4 |
| 20 | 0.0 | 7.3 | 79 | 1011.4 | 1.0 | 58 | 14.1 | 1.3 | 97 | 50 | 1015.8 | 1006.1 | 6.8 |
| 21 | 0.0 | 7.8 | 76 | 1012.8 | 0.7 | 114 | 15.7 | -0.7 | 96 | 51 | 1015.8 | 1010.1 | 5.4 |
| 22 | 0.0 | 13.4 | 65 | 1014.2 | 1.1 | 202 | 19.9 | 7.9 | 94 | 46 | 1022.9 | 1009.3 | 10.4 |
| 23 | 0.0 | 11.0 | 87 | 1023.4 | 1.1 | 23 | 16.7 | 6.1 | 100 | 69 | 1025.9 | 1018.9 | 11.2 |
| 24 | 0.0 | 11.4 | 78 | 1010.9 | 0.8 | 67 | 20.8 | 6.4 | 98 | 46 | 1018.9 | 1006.0 | 9.0 |
| 25 | 0.0 | 13.2 | 69 | 1005.4 | 1.3 | 220 | 20.9 | 7.4 | 86 | 42 | 1008.2 | 1003.3 | 9.0 |
| 26 | 0.0 | 11.2 | 71 | 1006.0 | 0.8 | 117 | 18.1 | 4.8 | 94 | 39 | 1008.3 | 1003.0 | 9.0 |
| 27 | 0.0 | 12.8 | 68 | 1018.5 | 1.3 | 223 | 17.5 | 9.2 | 83 | 49 | 1025.2 | 1008.3 | 9.0 |
| 28 | 0.0 | 8.9 | 86 | 1024.4 | 0.3 | 180 | 11.8 | 6.1 | 94 | 78 | 1025.2 | 1024.0 | 1.8 |
| 29 | - | - | - | - | - | - | - | - | - | - | - | - | - |
| 30 | - | - | - | - | - | - | - | - | - | - | - | - | - |
| 31 | - | - | - | - | - | - | - | - | - | - | - | - | - |
Gráficas


