SOMIÓ (Gijón) - diciembre 1996
Resumen del mes:
Nota: Estos datos se han actualizado a
las 17:01 del día 27/12/01 y, por consiguiente, no
corresponden al mes entero.
- Valores medios:
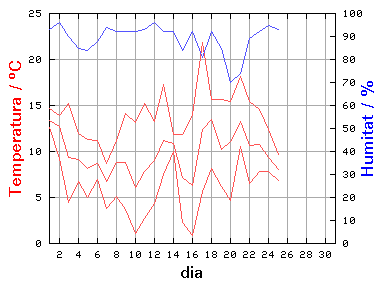
- Temperatura: 9.8 °C
- Humedad: 89 %
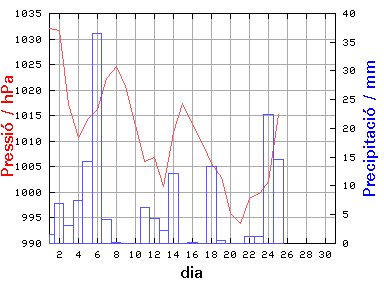
- Presión: 1011.2 hPa
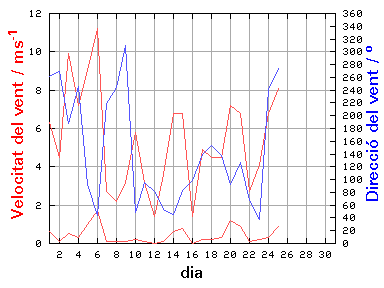
- Velocidad del viento: 0.4 m/s
- Dirección: 157 °
- Precipitación: 153.0 mm
- Valores extremos:
- Temperatura máxima: 21.8 °C el día 17 a las 15:00
- Temperatura mínima: 0.9 °C el día 16 a las 05:00
- Humedad máxima: 99 % el día 3 a las 11:00
- Humedad mínima: 48 % el día 21 a las 13:00
- Presión máxima: 1033.6 hPa el día 2 a las 11:00
- Presión mínima: 989.0 hPa el día 21 a las 05:00
- Velocidad máxima del viento: 11.2 m/s el día 6 a las 18:00
- Precipitación máxima: 36.6 mm el día 6
Resumen diario:
| Día | Lluvia | Valores medios | Valores extremos |
|---|
| Temp | Hum | Pres | VV | DV | Temperatura | Humedad | Presión | VV |
| máx | mín | máx | mín | máx | mín |
|---|
| mm | °C | % | hPa | m/s | ° | °C | °C | % | % | hPa | hPa | m/s |
| 1 | 1.6 | 13.4 | 93 | 1032.1 | 0.6 | 262 | 14.7 | 12.6 | 98 | 81 | 1033.2 | 1031.3 | 6.3 |
| 2 | 7.0 | 12.7 | 96 | 1031.6 | 0.1 | 269 | 13.9 | 9.2 | 98 | 90 | 1033.6 | 1027.6 | 4.5 |
| 3 | 3.2 | 9.4 | 90 | 1017.2 | 0.5 | 188 | 15.2 | 4.5 | 99 | 69 | 1027.6 | 1009.5 | 9.9 |
| 4 | 7.4 | 9.1 | 85 | 1010.8 | 0.3 | 246 | 12.0 | 6.7 | 94 | 66 | 1013.0 | 1009.7 | 7.2 |
| 5 | 14.2 | 8.2 | 84 | 1014.3 | 1.0 | 93 | 11.3 | 5.0 | 95 | 65 | 1015.6 | 1012.8 | 9.0 |
| 6 | 36.6 | 8.7 | 88 | 1016.3 | 1.7 | 44 | 11.2 | 7.0 | 93 | 73 | 1018.7 | 1015.1 | 11.2 |
| 7 | 4.2 | 6.7 | 94 | 1022.3 | 0.1 | 219 | 8.7 | 3.8 | 97 | 88 | 1025.3 | 1018.7 | 2.7 |
| 8 | 0.2 | 8.8 | 92 | 1024.6 | 0.1 | 244 | 11.2 | 5.1 | 97 | 84 | 1025.6 | 1023.5 | 2.2 |
| 9 | 0.0 | 8.8 | 92 | 1020.7 | 0.1 | 310 | 14.1 | 3.7 | 97 | 76 | 1024.4 | 1017.0 | 3.2 |
| 10 | 0.0 | 6.1 | 92 | 1013.0 | 0.2 | 49 | 13.2 | 1.1 | 98 | 78 | 1017.0 | 1009.8 | 5.8 |
| 11 | 6.2 | 7.8 | 93 | 1006.0 | 0.1 | 96 | 15.2 | 2.7 | 97 | 74 | 1009.8 | 1004.5 | 3.2 |
| 12 | 4.4 | 9.0 | 96 | 1006.9 | 0.0 | 82 | 13.3 | 4.3 | 99 | 92 | 1009.1 | 1004.2 | 1.4 |
| 13 | 2.2 | 11.2 | 92 | 1001.2 | 0.1 | 53 | 17.3 | 7.5 | 99 | 69 | 1004.2 | 998.7 | 3.6 |
| 14 | 12.2 | 10.9 | 92 | 1011.8 | 0.6 | 45 | 11.9 | 10.0 | 98 | 74 | 1018.9 | 1002.1 | 6.8 |
| 15 | 0.0 | 7.2 | 84 | 1017.3 | 0.8 | 83 | 11.8 | 2.3 | 96 | 68 | 1018.9 | 1015.9 | 6.8 |
| 16 | 0.2 | 6.3 | 92 | 1013.2 | 0.0 | 99 | 14.0 | 0.9 | 98 | 75 | 1016.3 | 1011.0 | 1.4 |
| 17 | 0.0 | 12.4 | 81 | 1009.5 | 0.2 | 139 | 21.8 | 5.6 | 99 | 53 | 1012.7 | 1006.2 | 4.9 |
| 18 | 13.4 | 13.5 | 92 | 1005.6 | 0.2 | 154 | 15.7 | 8.2 | 99 | 81 | 1007.2 | 1003.5 | 4.5 |
| 19 | 0.6 | 10.2 | 85 | 1002.9 | 0.3 | 138 | 15.6 | 6.2 | 98 | 62 | 1005.1 | 998.6 | 4.5 |
| 20 | 0.0 | 11.1 | 70 | 995.9 | 1.2 | 93 | 15.4 | 4.7 | 93 | 54 | 998.7 | 991.2 | 7.2 |
| 21 | 0.0 | 13.3 | 74 | 994.0 | 0.9 | 127 | 18.2 | 10.5 | 87 | 48 | 998.7 | 989.0 | 6.8 |
| 22 | 1.2 | 10.7 | 89 | 998.9 | 0.1 | 67 | 15.4 | 6.5 | 96 | 71 | 1000.4 | 997.2 | 2.7 |
| 23 | 1.2 | 10.8 | 92 | 999.8 | 0.2 | 37 | 14.6 | 7.8 | 98 | 74 | 1000.2 | 998.8 | 4.1 |
| 24 | 22.4 | 9.3 | 95 | 1002.2 | 0.3 | 241 | 12.4 | 7.8 | 98 | 84 | 1009.8 | 997.8 | 6.8 |
| 25 | 14.6 | 8.0 | 93 | 1015.3 | 0.9 | 274 | 9.7 | 6.8 | 97 | 88 | 1020.9 | 1009.8 | 8.1 |
| 26 | - | - | - | - | - | - | - | - | - | - | - | - | - |
| 27 | - | - | - | - | - | - | - | - | - | - | - | - | - |
| 28 | - | - | - | - | - | - | - | - | - | - | - | - | - |
| 29 | - | - | - | - | - | - | - | - | - | - | - | - | - |
| 30 | - | - | - | - | - | - | - | - | - | - | - | - | - |
| 31 | - | - | - | - | - | - | - | - | - | - | - | - | - |
Gráficas