MONZÓN - agosto 2003
Resumen del mes:
- Valores medios:
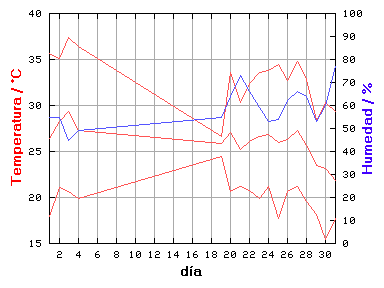
- Temperatura: 26.0 °C
- Humedad: 60 %
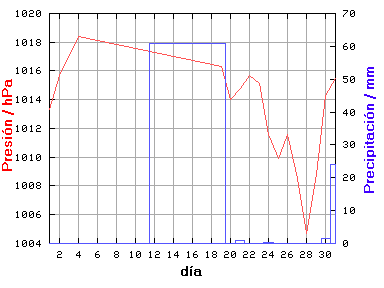
- Presión: 1012.9 hPa
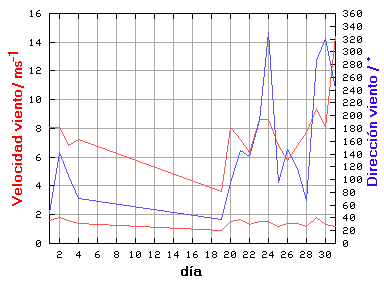
- Velocidad del viento: 1.4 m/s
- Dirección: 145 °
- Precipitación: 87.8 mm
- Valores extremos:
- Temperatura máxima: 37.4 °C el día 3 a las 16:30
- Temperatura mínima: 15.4 °C el día 30 a las 05:30
- Humedad máxima: 97 % el día 31 a las 23:00
- Humedad mínima: 25 % el día 1 a las 15:00
- Presión máxima: 1019.1 hPa el día 4 a las 08:00
- Presión mínima: 1000.9 hPa el día 28 a las 18:00
- Velocidad máxima del viento: 14.4 m/s el día 31 a las 17:30
- Precipitación máxima: 61.0 mm el día 19
Resumen diario:
| Día | Lluvia | Valores medios | Valores extremos |
|---|
| Temp | Hum | Pres | VV | DV | Temperatura | Humedad | Presión | VV |
| máx | mín | máx | mín | máx | mín |
|---|
| mm | °C | % | hPa | m/s | ° | °C | °C | % | % | hPa | hPa | m/s |
| 1 | 0.0 | 26.4 | 55 | 1013.3 | 1.6 | 47 | 35.6 | 17.9 | 79 | 25 | 1015.7 | 1010.9 | 8.1 |
| 2 | 0.0 | 28.3 | 55 | 1015.7 | 1.8 | 143 | 35.1 | 21.1 | 82 | 31 | 1017.2 | 1013.7 | 8.1 |
| 3 | 0.0 | 29.4 | 45 | 1017.0 | 1.6 | 106 | 37.4 | 20.7 | 71 | 25 | 1019.0 | 1015.0 | 6.8 |
| 4 | 0.0 | 27.3 | 49 | 1018.4 | 1.4 | 71 | 36.4 | 19.9 | 71 | 28 | 1019.1 | 1016.8 | 7.2 |
| 5 | - | - | - | - | - | - | - | - | - | - | - | - | - |
| 6 | - | - | - | - | - | - | - | - | - | - | - | - | - |
| 7 | - | - | - | - | - | - | - | - | - | - | - | - | - |
| 8 | - | - | - | - | - | - | - | - | - | - | - | - | - |
| 9 | - | - | - | - | - | - | - | - | - | - | - | - | - |
| 10 | - | - | - | - | - | - | - | - | - | - | - | - | - |
| 11 | - | - | - | - | - | - | - | - | - | - | - | - | - |
| 12 | - | - | - | - | - | - | - | - | - | - | - | - | - |
| 13 | - | - | - | - | - | - | - | - | - | - | - | - | - |
| 14 | - | - | - | - | - | - | - | - | - | - | - | - | - |
| 15 | - | - | - | - | - | - | - | - | - | - | - | - | - |
| 16 | - | - | - | - | - | - | - | - | - | - | - | - | - |
| 17 | - | - | - | - | - | - | - | - | - | - | - | - | - |
| 18 | - | - | - | - | - | - | - | - | - | - | - | - | - |
| 19 | 61.0 | 25.9 | 55 | 1016.3 | 0.9 | 38 | 26.6 | 24.5 | 61 | 49 | 1016.4 | 1016.2 | 3.6 |
| 20 | 0.0 | 27.1 | 64 | 1014.0 | 1.5 | 96 | 33.6 | 20.6 | 83 | 41 | 1016.4 | 1011.0 | 8.1 |
| 21 | 0.8 | 25.2 | 73 | 1014.8 | 1.7 | 145 | 30.3 | 21.2 | 86 | 55 | 1016.4 | 1012.8 | 7.2 |
| 22 | 0.0 | 26.1 | 66 | 1015.7 | 1.3 | 136 | 32.4 | 20.8 | 91 | 43 | 1017.7 | 1013.6 | 6.3 |
| 23 | 0.0 | 26.6 | 59 | 1015.1 | 1.5 | 192 | 33.6 | 19.9 | 86 | 33 | 1017.3 | 1012.7 | 8.6 |
| 24 | 0.4 | 26.8 | 53 | 1011.6 | 1.5 | 331 | 33.8 | 21.2 | 74 | 32 | 1014.3 | 1009.3 | 8.6 |
| 25 | 0.0 | 26.0 | 54 | 1009.9 | 1.2 | 95 | 34.5 | 17.7 | 86 | 29 | 1011.4 | 1007.3 | 6.8 |
| 26 | 0.0 | 26.3 | 62 | 1011.6 | 1.4 | 147 | 32.7 | 20.6 | 84 | 37 | 1013.6 | 1009.8 | 5.8 |
| 27 | 0.0 | 27.3 | 66 | 1008.5 | 1.4 | 118 | 34.8 | 21.2 | 88 | 35 | 1011.5 | 1005.3 | 6.8 |
| 28 | 0.0 | 25.7 | 64 | 1004.7 | 1.2 | 67 | 32.8 | 19.6 | 90 | 33 | 1006.9 | 1000.9 | 7.7 |
| 29 | 0.0 | 23.5 | 53 | 1008.8 | 1.8 | 286 | 28.4 | 18.2 | 77 | 37 | 1013.3 | 1005.6 | 9.4 |
| 30 | 1.6 | 23.2 | 60 | 1014.3 | 1.3 | 321 | 30.3 | 15.4 | 86 | 38 | 1016.4 | 1012.4 | 8.1 |
| 31 | 24.0 | 21.8 | 77 | 1015.5 | 1.2 | 242 | 29.3 | 17.7 | 97 | 44 | 1017.4 | 1011.6 | 14.4 |
Gráficas


