MONZÓN - septiembre 2004
Resumen del mes:
- Valores medios:
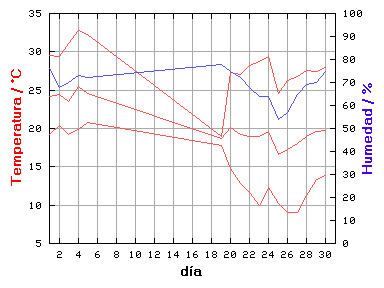
- Temperatura: 20.3 °C
- Humedad: 69 %
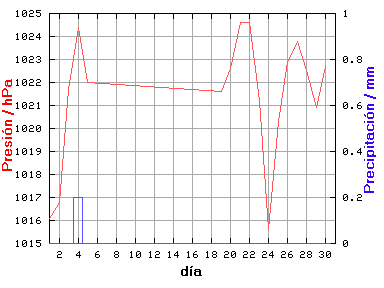
- Presión: 1021.4 hPa
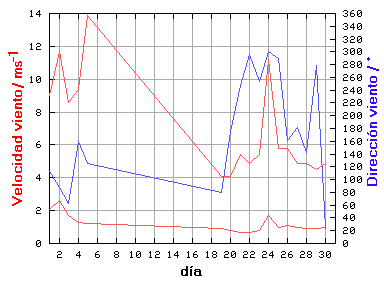
- Velocidad del viento: 1.2 m/s
- Dirección: 162 °
- Precipitación: 0.2 mm
- Valores extremos:
- Temperatura máxima: 32.8 °C el día 4 a las 15:27
- Temperatura mínima: 9.1 °C el día 26 a las 06:00
- Humedad máxima: 95 % el día 20 a las 03:30
- Humedad mínima: 28 % el día 25 a las 14:30
- Presión máxima: 1027.3 hPa el día 4 a las 01:57
- Presión mínima: 1012.0 hPa el día 24 a las 16:00
- Velocidad máxima del viento: 13.9 m/s el día 5 a las 09:27
- Precipitación máxima: 0.2 mm el día 4
Resumen diario:
| Día | Lluvia | Valores medios | Valores extremos |
|---|
| Temp | Hum | Pres | VV | DV | Temperatura | Humedad | Presión | VV |
| máx | mín | máx | mín | máx | mín |
|---|
| mm | °C | % | hPa | m/s | ° | °C | °C | % | % | hPa | hPa | m/s |
| 1 | 0.0 | 24.2 | 76 | 1016.1 | 2.1 | 113 | 29.5 | 19.2 | 94 | 56 | 1018.0 | 1013.4 | 9.0 |
| 2 | 0.0 | 24.4 | 68 | 1016.8 | 2.6 | 88 | 29.4 | 20.4 | 80 | 54 | 1019.7 | 1015.8 | 11.7 |
| 3 | 0.0 | 23.5 | 70 | 1021.7 | 1.7 | 63 | 31.1 | 19.2 | 84 | 45 | 1024.7 | 1020.0 | 8.6 |
| 4 | 0.2 | 25.5 | 73 | 1024.4 | 1.3 | 159 | 32.8 | 19.9 | 92 | 46 | 1027.3 | 1022.5 | 9.4 |
| 5 | 0.0 | 24.5 | 72 | 1022.0 | 1.2 | 126 | 32.3 | 20.8 | 90 | 50 | 1024.1 | 1019.5 | 13.9 |
| 6 | - | - | - | - | - | - | - | - | - | - | - | - | - |
| 7 | - | - | - | - | - | - | - | - | - | - | - | - | - |
| 8 | - | - | - | - | - | - | - | - | - | - | - | - | - |
| 9 | - | - | - | - | - | - | - | - | - | - | - | - | - |
| 10 | - | - | - | - | - | - | - | - | - | - | - | - | - |
| 11 | - | - | - | - | - | - | - | - | - | - | - | - | - |
| 12 | - | - | - | - | - | - | - | - | - | - | - | - | - |
| 13 | - | - | - | - | - | - | - | - | - | - | - | - | - |
| 14 | - | - | - | - | - | - | - | - | - | - | - | - | - |
| 15 | - | - | - | - | - | - | - | - | - | - | - | - | - |
| 16 | - | - | - | - | - | - | - | - | - | - | - | - | - |
| 17 | - | - | - | - | - | - | - | - | - | - | - | - | - |
| 18 | - | - | - | - | - | - | - | - | - | - | - | - | - |
| 19 | 0.0 | 18.7 | 78 | 1021.6 | 0.9 | 80 | 18.9 | 17.8 | 81 | 76 | 1021.8 | 1021.5 | 4.1 |
| 20 | 0.0 | 20.1 | 75 | 1022.6 | 0.8 | 176 | 27.3 | 14.8 | 95 | 51 | 1024.0 | 1021.3 | 4.1 |
| 21 | 0.0 | 19.2 | 72 | 1024.6 | 0.7 | 247 | 27.1 | 12.8 | 90 | 40 | 1026.1 | 1023.0 | 5.4 |
| 22 | 0.0 | 19.0 | 68 | 1024.6 | 0.7 | 296 | 28.2 | 11.6 | 92 | 41 | 1027.0 | 1022.0 | 4.9 |
| 23 | 0.0 | 19.0 | 64 | 1021.2 | 0.8 | 254 | 28.8 | 9.9 | 90 | 34 | 1024.3 | 1017.9 | 5.4 |
| 24 | 0.0 | 19.6 | 64 | 1015.6 | 1.7 | 301 | 29.4 | 12.3 | 89 | 41 | 1017.9 | 1012.0 | 11.2 |
| 25 | 0.0 | 16.6 | 54 | 1020.3 | 1.0 | 289 | 24.6 | 10.2 | 80 | 28 | 1023.5 | 1017.3 | 5.8 |
| 26 | 0.0 | 17.3 | 57 | 1022.9 | 1.1 | 161 | 26.3 | 9.1 | 84 | 32 | 1025.3 | 1019.9 | 5.8 |
| 27 | 0.0 | 18.0 | 65 | 1023.8 | 1.0 | 182 | 26.8 | 9.1 | 86 | 38 | 1025.5 | 1021.8 | 4.9 |
| 28 | 0.0 | 18.9 | 69 | 1022.5 | 0.9 | 142 | 27.6 | 11.3 | 91 | 39 | 1024.9 | 1019.3 | 4.9 |
| 29 | 0.0 | 19.6 | 70 | 1020.9 | 0.9 | 279 | 27.4 | 13.4 | 86 | 41 | 1022.4 | 1018.7 | 4.5 |
| 30 | 0.0 | 19.7 | 75 | 1022.7 | 1.0 | 24 | 27.9 | 13.9 | 92 | 44 | 1024.5 | 1021.2 | 4.9 |
| 31 | - | - | - | - | - | - | - | - | - | - | - | - | - |
Gráficas


