MONZÓN - diciembre 2004
Resumen del mes:
- Valores medios:
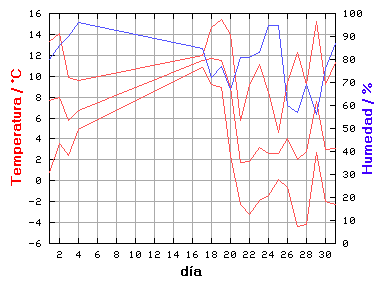
- Temperatura: 5.3 °C
- Humedad: 78 %
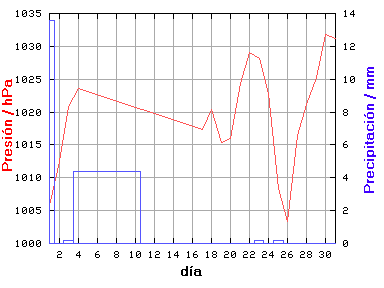
- Presión: 1019.8 hPa
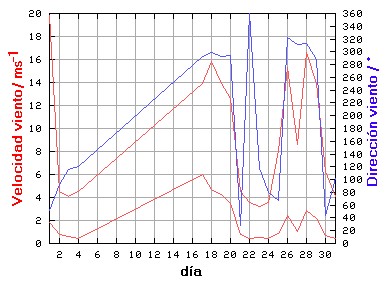
- Velocidad del viento: 1.6 m/s
- Dirección: 27 °
- Precipitación: 18.6 mm
- Valores extremos:
- Temperatura máxima: 15.4 °C el día 19 a las 13:30
- Temperatura mínima: -4.4 °C el día 27 a las 08:00
- Humedad máxima: 100 % el día 25 a las 03:00
- Humedad mínima: 22 % el día 26 a las 14:00
- Presión máxima: 1034.9 hPa el día 30 a las 10:30
- Presión mínima: 998.8 hPa el día 1 a las 21:00
- Velocidad máxima del viento: 19.8 m/s el día 1 a las 21:00
- Precipitación máxima: 13.6 mm el día 1
Resumen diario:
| Día | Lluvia | Valores medios | Valores extremos |
|---|
| Temp | Hum | Pres | VV | DV | Temperatura | Humedad | Presión | VV |
| máx | mín | máx | mín | máx | mín |
|---|
| mm | °C | % | hPa | m/s | ° | °C | °C | % | % | hPa | hPa | m/s |
| 1 | 13.6 | 7.7 | 80 | 1005.8 | 1.8 | 51 | 13.3 | 0.8 | 97 | 53 | 1010.6 | 998.8 | 19.8 |
| 2 | 0.0 | 8.0 | 86 | 1012.5 | 0.8 | 93 | 14.1 | 3.6 | 99 | 57 | 1018.4 | 1005.6 | 4.5 |
| 3 | 0.2 | 5.8 | 90 | 1020.8 | 0.6 | 116 | 9.9 | 2.4 | 96 | 77 | 1023.2 | 1018.3 | 4.1 |
| 4 | 4.4 | 6.7 | 96 | 1023.6 | 0.4 | 120 | 9.6 | 4.9 | 99 | 85 | 1025.2 | 1022.2 | 4.5 |
| 5 | - | - | - | - | - | - | - | - | - | - | - | - | - |
| 6 | - | - | - | - | - | - | - | - | - | - | - | - | - |
| 7 | - | - | - | - | - | - | - | - | - | - | - | - | - |
| 8 | - | - | - | - | - | - | - | - | - | - | - | - | - |
| 9 | - | - | - | - | - | - | - | - | - | - | - | - | - |
| 10 | - | - | - | - | - | - | - | - | - | - | - | - | - |
| 11 | - | - | - | - | - | - | - | - | - | - | - | - | - |
| 12 | - | - | - | - | - | - | - | - | - | - | - | - | - |
| 13 | - | - | - | - | - | - | - | - | - | - | - | - | - |
| 14 | - | - | - | - | - | - | - | - | - | - | - | - | - |
| 15 | - | - | - | - | - | - | - | - | - | - | - | - | - |
| 16 | - | - | - | - | - | - | - | - | - | - | - | - | - |
| 17 | 0.0 | 11.5 | 85 | 1017.3 | 6.0 | 292 | 12.0 | 10.8 | 88 | 82 | 1017.7 | 1017.0 | 13.9 |
| 18 | 0.0 | 11.7 | 72 | 1020.4 | 4.7 | 299 | 14.7 | 9.2 | 88 | 55 | 1022.0 | 1016.9 | 15.8 |
| 19 | 0.0 | 11.5 | 77 | 1015.3 | 4.3 | 292 | 15.4 | 8.9 | 90 | 62 | 1020.5 | 1012.0 | 13.9 |
| 20 | 0.0 | 8.9 | 67 | 1016.0 | 3.5 | 294 | 14.0 | 2.4 | 85 | 44 | 1022.3 | 1011.9 | 12.6 |
| 21 | 0.0 | 1.7 | 81 | 1024.3 | 0.8 | 28 | 5.8 | -2.3 | 89 | 70 | 1027.2 | 1022.3 | 4.5 |
| 22 | 0.0 | 1.8 | 81 | 1029.0 | 0.4 | 360 | 9.2 | -3.2 | 93 | 59 | 1031.4 | 1027.1 | 3.6 |
| 23 | 0.2 | 3.2 | 83 | 1028.1 | 0.5 | 117 | 11.1 | -1.9 | 95 | 59 | 1030.0 | 1026.4 | 3.2 |
| 24 | 0.0 | 2.6 | 95 | 1022.9 | 0.4 | 80 | 8.4 | -1.4 | 99 | 86 | 1027.3 | 1016.0 | 3.6 |
| 25 | 0.2 | 2.6 | 95 | 1008.4 | 0.9 | 68 | 4.6 | 0.1 | 100 | 77 | 1016.0 | 1002.7 | 8.1 |
| 26 | 0.0 | 4.0 | 60 | 1003.4 | 2.4 | 323 | 9.4 | -0.6 | 88 | 22 | 1009.2 | 1000.6 | 15.3 |
| 27 | 0.0 | 2.0 | 57 | 1016.4 | 1.0 | 312 | 12.3 | -4.4 | 84 | 27 | 1023.2 | 1009.2 | 8.6 |
| 28 | 0.0 | 2.8 | 69 | 1021.1 | 2.9 | 313 | 9.2 | -4.2 | 80 | 45 | 1023.8 | 1016.4 | 16.6 |
| 29 | 0.0 | 7.6 | 56 | 1025.2 | 2.2 | 288 | 15.2 | 2.7 | 76 | 24 | 1028.3 | 1023.2 | 13.9 |
| 30 | 0.0 | 3.0 | 76 | 1031.8 | 0.7 | 44 | 9.2 | -2.0 | 87 | 63 | 1034.9 | 1028.1 | 6.3 |
| 31 | 0.0 | 3.1 | 87 | 1031.2 | 0.4 | 102 | 11.3 | -2.3 | 97 | 74 | 1033.0 | 1029.5 | 4.1 |
Gráficas


