MONZÓN - mayo 2005
Resumen del mes:
Nota: Estos datos se han actualizado a
las 05:28 del día 17/5/05 y, por consiguiente, no
corresponden al mes entero.
- Valores medios:
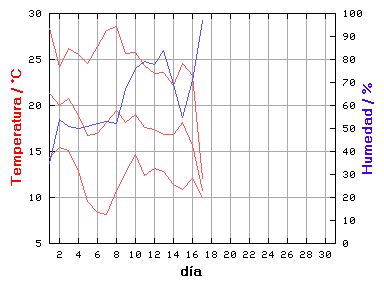
- Temperatura: 17.6 °C
- Humedad: 64 %
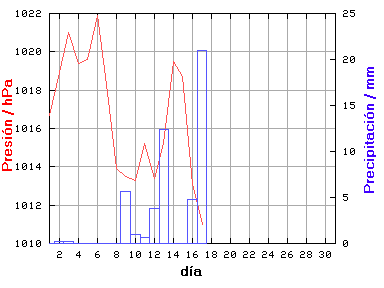
- Presión: 1016.4 hPa
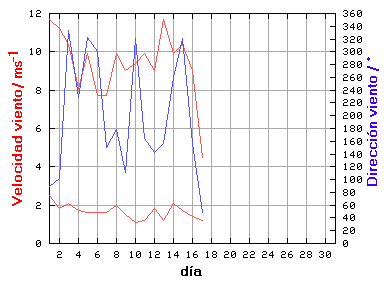
- Velocidad del viento: 1.6 m/s
- Dirección: 84 °
- Precipitación: 49.6 mm
- Valores extremos:
- Temperatura máxima: 28.6 °C el día 8 a las 16:00
- Temperatura mínima: 8.1 °C el día 7 a las 06:00
- Humedad máxima: 100 % el día 13 a las 23:00
- Humedad mínima: 22 % el día 3 a las 16:00
- Presión máxima: 1024.3 hPa el día 6 a las 07:30
- Presión mínima: 1010.2 hPa el día 16 a las 17:00
- Velocidad máxima del viento: 11.7 m/s el día 1 a las 15:00
- Precipitación máxima: 21.0 mm el día 17
Resumen diario:
| Día | Lluvia | Valores medios | Valores extremos |
|---|
| Temp | Hum | Pres | VV | DV | Temperatura | Humedad | Presión | VV |
| máx | mín | máx | mín | máx | mín |
|---|
| mm | °C | % | hPa | m/s | ° | °C | °C | % | % | hPa | hPa | m/s |
| 1 | 0.0 | 21.3 | 35 | 1016.7 | 2.5 | 89 | 28.4 | 14.3 | 50 | 24 | 1017.6 | 1014.9 | 11.7 |
| 2 | 0.2 | 20.0 | 54 | 1018.9 | 1.8 | 101 | 24.2 | 15.4 | 70 | 38 | 1020.1 | 1016.9 | 11.2 |
| 3 | 0.2 | 20.8 | 51 | 1021.0 | 2.1 | 334 | 26.2 | 15.1 | 85 | 22 | 1022.0 | 1019.7 | 10.4 |
| 4 | 0.0 | 18.9 | 50 | 1019.4 | 1.7 | 229 | 25.5 | 12.8 | 65 | 34 | 1021.6 | 1016.0 | 8.1 |
| 5 | 0.0 | 16.7 | 51 | 1019.6 | 1.6 | 322 | 24.6 | 9.6 | 76 | 24 | 1022.8 | 1017.3 | 9.9 |
| 6 | 0.0 | 17.0 | 52 | 1021.9 | 1.6 | 301 | 26.4 | 8.4 | 77 | 25 | 1024.3 | 1018.7 | 7.7 |
| 7 | 0.0 | 18.2 | 53 | 1018.3 | 1.6 | 151 | 28.2 | 8.1 | 80 | 24 | 1021.5 | 1014.3 | 7.7 |
| 8 | 0.0 | 19.5 | 52 | 1013.9 | 2.0 | 179 | 28.6 | 10.8 | 75 | 26 | 1016.2 | 1010.4 | 9.9 |
| 9 | 5.6 | 18.1 | 67 | 1013.5 | 1.5 | 111 | 25.6 | 12.7 | 96 | 41 | 1015.3 | 1010.6 | 9.0 |
| 10 | 1.0 | 19.0 | 76 | 1013.3 | 1.1 | 321 | 25.8 | 14.7 | 99 | 48 | 1015.5 | 1011.3 | 9.4 |
| 11 | 0.6 | 17.6 | 79 | 1015.2 | 1.2 | 165 | 24.3 | 12.4 | 96 | 48 | 1016.8 | 1012.8 | 9.9 |
| 12 | 3.8 | 17.4 | 78 | 1013.4 | 1.8 | 143 | 23.5 | 13.2 | 94 | 54 | 1015.5 | 1011.0 | 9.0 |
| 13 | 12.4 | 16.8 | 84 | 1015.2 | 1.2 | 157 | 23.6 | 12.8 | 100 | 54 | 1017.0 | 1012.6 | 11.7 |
| 14 | 0.0 | 16.8 | 69 | 1019.5 | 2.1 | 260 | 22.2 | 11.4 | 100 | 38 | 1021.7 | 1016.5 | 9.9 |
| 15 | 0.0 | 18.1 | 55 | 1018.7 | 1.7 | 321 | 24.6 | 10.9 | 84 | 28 | 1021.4 | 1015.7 | 10.4 |
| 16 | 4.8 | 15.7 | 71 | 1013.1 | 1.4 | 156 | 23.3 | 12.1 | 93 | 36 | 1016.1 | 1010.2 | 9.0 |
| 17 | 21.0 | 10.8 | 97 | 1011.0 | 1.2 | 49 | 12.1 | 10.0 | 100 | 93 | 1011.7 | 1010.4 | 4.5 |
| 18 | - | - | - | - | - | - | - | - | - | - | - | - | - |
| 19 | - | - | - | - | - | - | - | - | - | - | - | - | - |
| 20 | - | - | - | - | - | - | - | - | - | - | - | - | - |
| 21 | - | - | - | - | - | - | - | - | - | - | - | - | - |
| 22 | - | - | - | - | - | - | - | - | - | - | - | - | - |
| 23 | - | - | - | - | - | - | - | - | - | - | - | - | - |
| 24 | - | - | - | - | - | - | - | - | - | - | - | - | - |
| 25 | - | - | - | - | - | - | - | - | - | - | - | - | - |
| 26 | - | - | - | - | - | - | - | - | - | - | - | - | - |
| 27 | - | - | - | - | - | - | - | - | - | - | - | - | - |
| 28 | - | - | - | - | - | - | - | - | - | - | - | - | - |
| 29 | - | - | - | - | - | - | - | - | - | - | - | - | - |
| 30 | - | - | - | - | - | - | - | - | - | - | - | - | - |
| 31 | - | - | - | - | - | - | - | - | - | - | - | - | - |
Gráficas


