Sant Hip˛lit de VoltregÓ - octubre 2010
Resum del mes:
Nota: Aquest fitxer s'ha actualitzat a
les 22:53 del dia 31/10/10 i, per tant, no
conté tot el mes sencer.
- Valors mitjans:
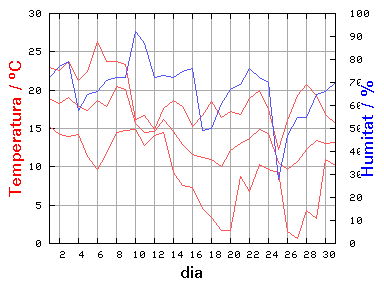
- Temperatura: 14.5 °C
- Humitat: 66 %
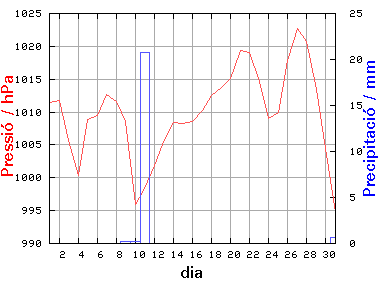
- Pressió: 1009.9 hPa
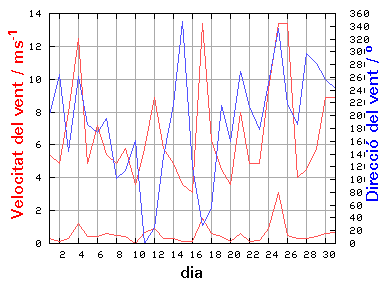
- Velocitat del vent: 0.6 m/s
- Direcció: 201 °
- Precipitació: 21.8 mm
- Extrems:
- Temperatura màxima: 26.4 °C el dia 6 a les 14:50
- Temperatura mínima: 0.6 °C el dia 27 a les 07:00
- Humitat màxima: 95 % el dia 3 a les 09:10
- Humitat mínima: 17 % el dia 18 a les 15:00
- Pressió màxima: 1025.4 hPa el dia 27 a les 08:00
- Pressió mínima: 990.6 hPa el dia 31 a les 12:50
- Velocitat màxima del vent: 13.4 m/s el dia 17 a les 19:40
- Precipitació màxima: 20.8 mm el dia 11
Resum diari:
| Dia | Pluja | Valors mitjans | Valors extrems |
|---|
| Temp | Hum | Pres | VV | DV | Temperatura | Humitat | Pressió | VV |
| màx | mín | màx | mín | màx | mín |
|---|
| mm | °C | % | hPa | m/s | ° | °C | °C | % | % | hPa | hPa | m/s |
| 1 | 0.0 | 18.9 | 72 | 1011.5 | 0.3 | 200 | 22.9 | 15.3 | 90 | 52 | 1013.5 | 1008.8 | 5.4 |
| 2 | 0.0 | 18.2 | 77 | 1011.8 | 0.1 | 265 | 22.6 | 14.2 | 93 | 58 | 1014.5 | 1009.5 | 4.9 |
| 3 | 0.0 | 19.0 | 79 | 1005.7 | 0.3 | 144 | 23.7 | 14.0 | 95 | 59 | 1010.9 | 999.1 | 8.0 |
| 4 | 0.0 | 17.9 | 58 | 1000.3 | 1.2 | 261 | 21.3 | 14.2 | 87 | 47 | 1008.2 | 995.7 | 12.5 |
| 5 | 0.0 | 17.4 | 65 | 1008.9 | 0.4 | 186 | 22.4 | 11.3 | 86 | 42 | 1011.0 | 1006.4 | 4.9 |
| 6 | 0.0 | 18.6 | 66 | 1009.5 | 0.4 | 174 | 26.4 | 9.7 | 91 | 25 | 1013.0 | 1007.0 | 7.2 |
| 7 | 0.0 | 17.9 | 71 | 1012.7 | 0.6 | 195 | 23.7 | 11.8 | 91 | 44 | 1014.5 | 1010.5 | 5.4 |
| 8 | 0.0 | 20.5 | 72 | 1011.6 | 0.5 | 102 | 23.7 | 14.5 | 88 | 57 | 1012.8 | 1009.6 | 4.9 |
| 9 | 0.2 | 20.1 | 72 | 1008.5 | 0.4 | 114 | 23.4 | 14.7 | 91 | 53 | 1012.3 | 1002.4 | 5.8 |
| 10 | 0.2 | 15.6 | 92 | 996.0 | 0.0 | 161 | 16.2 | 14.9 | 94 | 81 | 1002.5 | 994.3 | 3.6 |
| 11 | 20.8 | 14.5 | 87 | 998.4 | 0.7 | 0 | 16.7 | 12.8 | 94 | 73 | 1003.3 | 993.6 | 5.8 |
| 12 | 0.0 | 14.6 | 72 | 1001.9 | 0.9 | 25 | 14.9 | 14.1 | 81 | 68 | 1003.0 | 1000.6 | 8.9 |
| 13 | 0.0 | 16.2 | 73 | 1005.5 | 0.3 | 136 | 17.6 | 14.5 | 86 | 61 | 1008.5 | 1002.0 | 5.8 |
| 14 | 0.0 | 14.6 | 72 | 1008.4 | 0.3 | 218 | 18.6 | 9.2 | 89 | 55 | 1009.8 | 1007.1 | 4.9 |
| 15 | 0.0 | 12.9 | 75 | 1008.2 | 0.1 | 347 | 17.9 | 7.5 | 93 | 56 | 1009.8 | 1006.0 | 3.6 |
| 16 | 0.0 | 11.6 | 76 | 1008.6 | 0.1 | 119 | 15.2 | 7.3 | 90 | 63 | 1010.8 | 1006.7 | 3.1 |
| 17 | 0.0 | 11.2 | 49 | 1010.3 | 1.5 | 28 | 16.7 | 4.6 | 92 | 21 | 1012.6 | 1007.5 | 13.4 |
| 18 | 0.0 | 11.0 | 50 | 1012.5 | 0.6 | 57 | 18.5 | 3.4 | 81 | 17 | 1015.6 | 1009.8 | 6.3 |
| 19 | 0.0 | 10.0 | 61 | 1013.8 | 0.4 | 216 | 16.4 | 1.7 | 85 | 36 | 1017.0 | 1010.9 | 4.5 |
| 20 | 0.0 | 12.1 | 67 | 1015.1 | 0.1 | 160 | 17.2 | 1.7 | 92 | 43 | 1019.2 | 1012.1 | 3.6 |
| 21 | 0.0 | 13.0 | 69 | 1019.3 | 0.6 | 270 | 16.8 | 8.8 | 89 | 50 | 1021.2 | 1017.3 | 8.0 |
| 22 | 0.0 | 13.7 | 76 | 1019.0 | 0.1 | 215 | 18.9 | 6.8 | 91 | 53 | 1022.3 | 1016.0 | 4.9 |
| 23 | 0.0 | 14.9 | 72 | 1014.7 | 0.2 | 179 | 19.9 | 10.3 | 94 | 44 | 1017.0 | 1012.2 | 4.9 |
| 24 | 0.0 | 14.4 | 70 | 1009.0 | 0.9 | 250 | 17.5 | 9.7 | 91 | 57 | 1013.9 | 1004.8 | 9.4 |
| 25 | 0.0 | 10.5 | 28 | 1010.0 | 3.1 | 336 | 12.3 | 9.2 | 42 | 22 | 1013.6 | 1005.9 | 13.4 |
| 26 | 0.0 | 9.7 | 47 | 1017.9 | 0.5 | 217 | 16.1 | 1.6 | 79 | 21 | 1024.1 | 1011.7 | 13.4 |
| 27 | 0.0 | 10.7 | 55 | 1022.7 | 0.3 | 187 | 19.3 | 0.6 | 87 | 17 | 1025.4 | 1019.1 | 4.0 |
| 28 | 0.0 | 12.3 | 55 | 1020.7 | 0.3 | 297 | 20.8 | 4.3 | 86 | 21 | 1024.5 | 1017.1 | 4.5 |
| 29 | 0.0 | 13.4 | 65 | 1013.4 | 0.4 | 281 | 19.3 | 3.3 | 87 | 31 | 1019.2 | 1007.4 | 5.8 |
| 30 | 0.0 | 13.0 | 66 | 1004.5 | 0.6 | 257 | 16.8 | 10.9 | 92 | 56 | 1007.7 | 999.8 | 8.9 |
| 31 | 0.6 | 13.2 | 70 | 994.7 | 0.7 | 242 | 15.7 | 10.2 | 92 | 55 | 999.8 | 990.6 | 8.9 |
Gràfiques


Retorn a l'índex d'InfoMet.


